This Simple 2-ETF Strategy Has Outperformed the Nasdaq for 13 Years
- Algomatic Trading

- May 6, 2025
- 3 min read
Updated: May 7, 2025
It all started with a single tweet from @thechartist on X: a chart showing how a 67% BTAL / 33% TQQQ allocation, rotated just once a year, relentlessly outpaced the Nasdaq since 2012.
I bookmarked that thread, skeptical at first, could something so simple really deliver almost 20% annualized returns with minimal effort?
For long-term traders and investors markets have never offered more low-cost funds, yet getting market-crushing returns feels harder than ever. You scroll through hundreds of tickers, debate momentum versus value—and then panic-sell when volatility spikes. Meanwhile, the average buy-and-hold portfolio still only delivers 8–10% CAGR, leaving many to wonder if all the effort is even worth it.
What if you could bypass the noise and in one simple annual decision capture almost 20% annualized returns, smooth out drawdowns, and also avoid nearly all screen-time? Almost sounds too good to be true. Since 2012, a straightforward 67% BTAL (market-neutral, anti-beta ETF) / 33% TQQQ (3×-geared Nasdaq ETF) annual rebalance has delivered precisely that:
• 19.57% CAGR (2012–2025)
• Max drawdown of –15.72%
• Sharpe ratio 1.14
8 of 13 years the strategy has outperformed the yearly returns of Nasdaq, yet the entire process takes under five minutes once per year. No complicated signals. No minute-by-minute monitoring. I really like simplicity in strategies, but is this too simple?
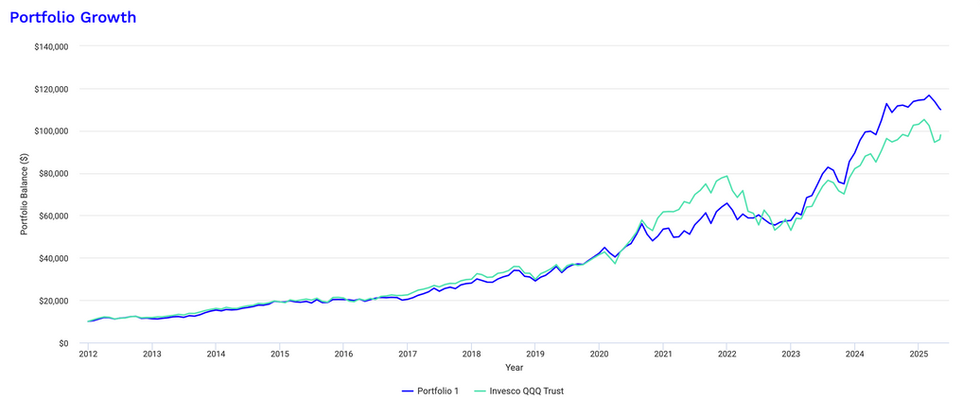
Since I typically doesn't trade rotational strategies or ETFs I am not using my standard platform ProRealTime for this backtest, I am using Portfoliovisualizer.com.
Here is a backtest of this strategy (Portfolio 1) from 2012-2025.

In this post you’ll discover:
Why pure buy-and-hold leaves you hostage to every crash.
Backtest statistics of this strategy.
A side-by-side comparison of annual vs. quarterly vs. monthly rotations.
Let’s dive in.
Why Buy-and-Hold Alone Fails
Most investors have been told: “Just buy the market and forget it.” It’s simple, low-fee, and over decades—stocks trend upward. But that advice glosses over two harsh realities:
• Deep, portfolio-wrenching drawdowns. Hold Nasdaq (QQQ) through the 2022 bear market in 2022, and you suffered a 35%+ drop before the rebound.
• Emotional panic. Watching 10–20% drops in days triggers doubt, leading many to sell near the bottom, leading to losses.
So, let's look at this strategy.
Instead of 100% long equity exposure, you split your capital:
• 67% in BTAL (market-neutral, short-beta exposures)
• 33% in TQQQ (3x leveraged Nasdaq exposure)
Once per year (I used calendar year for this backtest), you take a look at the weight between BTAL and TQQQ in your portfolio. You rebalance the portfolio with 67% to BTAL and 33% to TQQQ. That’s it.
Why this works:
• Anti-beta hedge. BTAL cushions downturns by shorting beta-sensitive stocks.
• With a 33% TQQQ you basically have a 99% portfolio exposure to Nasdaq while using leverage to hedge your downside with BTAL.
• It's simple, therefore easy to follow.
Here are some images from my backtest, I use Nasdaq (QQQ) as benchmark:


Comparing Rotation Frequency: Annual vs. Quarterly vs. Monthly
“Annual rotations set the baseline but what if you rebalanced more often? Here’s how frequency shapes returns and risk.”
Annual Rotation Baseline (Calendar Year)
• Results (2012–2025): 19.57% CAGR, –15.72% max DD, Sharpe 1.14
Quarterly Rotation Test
• Results (2012–2025): 17.28% CAGR, –23.45% max DD, Sharpe 1.06
Monthly Rotation Test
• Results (2012–2025): 16.24% CAGR, –25.09% max DD, Sharpe 1.03


At first glance you’d expect quicker rotations to fine‑tune exposure and squeeze out extra return. But the back‑test shows the opposite:
Frequency | CAGR | Max DD | Sharpe |
Annual | 19.57 % | ‑15.72 % | 1.14 |
Quarterly | 17.28 % | ‑23.45 % | 1.06 |
Monthly | 16.24 % | ‑25.09 % | 1.03 |
So, what’s going on?
Anti-Beta Timing Advantage
BTAL spikes when high‑beta melts down, but those spikes are lumpy and rarely last just 30–90 days. An annual reset lets the anti‑beta hedge fully do its job before you clip gains.
Volatility drag on TQQQ
Leveraged ETFs pay you when the index trends, but path‑dependence penalises whipsaws. Higher‑frequency rebalancing forces you to rebuy TQQQ after every mini‑pullback, compounding decay.
Turnover friction
Even at zero commissions, bid/ask and tracking error nibble away with each rebalance. Twelve nibbles a year add up.
Rebalance premium sweet spot
Annual rebalance capture the classic “sell winners / buy losers” effect without over‑trading. Quarterly and monthly schedules front‑run that mean‑reversion before it matures.
Bottom line: in this specific pairing, patience beats tinkering. One calendar‑day on your January checklist handily outperforms 4- or 12‑times‑a‑year micromanagement, delivering higher returns, shallower drawdowns, and more free weekends.
Get a Free, Fully‑Coded Trading Strategy + Access To Monthly Content


